Inference in regression
Confidence intervals and tests for coefficients in the SLR model
Today’s agenda
- [lecture] inference for the SLR model
- [lab] predicting brain size
From last time
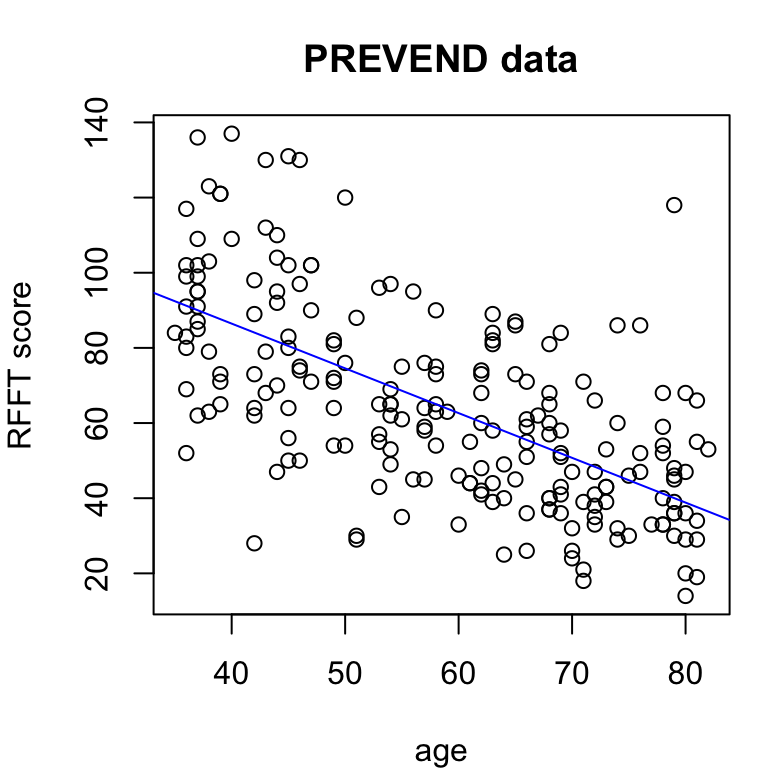
How much does RFFT decline with age?
Simple linear regression (SLR) model:
Call:
lm(formula = rfft ~ age, data = prevend)

Coefficients:
(Intercept)          age
    134.098       -1.191
Interpretation:
With each additional year of age, mean RFFT score decreases by an estimated 1.191 points.
From last time
The residual standard deviation is an estimate of the unexplained variation in RFFT.

More unexplained variation entails more sampling variability in the model fit.
Standard errors for the coefficients
Standard errors for the coefficients are:
While you won’t need to know these formulae, do notice that:
- more data
- more spread in
- more spread in
Inference for the slope parameter
If the errors are symmetric and unimodal, then the sampling distribution of

Significance test:
Confidence interval:
confidence interval using
Inference for the intercept is analogous, but not very common.
Model summary
The model summary shows most quantities of interest, except CIs.
Call:
lm(formula = rfft ~ age, data = prevend)

Residuals:
    Min      1Q  Median      3Q     Max
-56.085 -14.690  -2.937  12.744  77.975

Coefficients:
            Estimate Std. Error t value Pr(>|t|)
(Intercept) 134.0981     6.0701   22.09   <2e-16 ***
age          -1.1908     0.1007  -11.82   <2e-16 ***
---
Signif. codes:  0 '***' 0.001 '**' 0.01 '*' 0.05 '.' 0.1 ' ' 1

Residual standard error: 20.52 on 206 degrees of freedom
Multiple R-squared:  0.4043,    Adjusted R-squared:  0.4014
F-statistic: 139.8 on 1 and 206 DF, p-value: < 2.2e-16Age explains an estimated 40.43% of variation in RFFT.
With each year of age mean RFFT declines by an estimated 1.19 points (SE 0.10).
There is a significant association between age and mean RFFT score (T = -11.82 on 206 degrees of freedom, p < 0.0001).
Take a moment to locate the quantities that support the conclusions listed at right.
Confidence intervals
Confidence interval:
                 2.5 %      97.5 %
(Intercept) 122.130647 146.0654574
age          -1.389341  -0.9922471
With 95% confidence, each additional year of age is associated with a decrease in mean RFFT score of between 0.99 and 1.39 points.
Since the intercept is not meaningful in this context, we don’t interpret that interval.
Prediction in SLR

Intervals for the mean
There are two possible ways to interpret model predictions:
- The estimated mean RFFT score for 55-year-olds is 68.6
- The predicted value of RFFT for a specific 55-year-old individual is 68.6

With 95% confidence, the mean RFFT score among 55-year-olds is estimated to be between 65.71 and 71.50 points.
Intervals for predicted values
There are two possible ways to interpret model predictions:
- The estimated mean RFFT score for 55-year-olds is 68.6
- The predicted value of RFFT for a specific 55-year-old individual is 68.6

With 95% confidence, the RFFT score for an individual 55 year old is estimated to be between 28.05 and 109.16 points.
Uncertainty bands
Pointwise intervals shown along the line provide a visual of the model uncertainty.


Why the difference? Individual observations are more variable than averages.
Kleiber’s law
Call:
lm(formula = log.metab ~ log.mass, data = kleiber)

Residuals:
     Min       1Q   Median       3Q      Max
-1.14216 -0.26466 -0.04889  0.25308  1.37616

Coefficients:
            Estimate Std. Error t value Pr(>|t|)
(Intercept)  5.63833    0.04709  119.73   <2e-16 ***
log.mass     0.73874    0.01462   50.53   <2e-16 ***
---
Signif. codes:  0 '***' 0.001 '**' 0.01 '*' 0.05 '.' 0.1 ' ' 1

Residual standard error: 0.4572 on 93 degrees of freedom
Multiple R-squared:  0.9649,    Adjusted R-squared:  0.9645
F-statistic:  2553 on 1 and 93 DF,  p-value: < 2.2e-16
There is a significant association between body mass and metabolism (p < 0.0001): body mass explains 96.49% of variation in metabolism; with 95% confidence, a unit increment in log mass is associated with an estimated increase in mean log metabolism between 0.7097 and 0.7678.
Kleiber’s law
How much energy do we consume on a daily basis?
Conversions:
- 110lb
- 180lb
- 1 kJ

Using the SLR model, estimated resting energy consumption is:
Left, prediction curve with 95% confidence interval.
Kleiber’s law
How much energy do you consume on a daily basis?
Conversions:
- 110lb
- 180lb
- 1 kJ

Using the SLR model, estimated resting energy consumption is:
Left, prediction curve with 95% prediction interval.
Hubble constant
The Hubble constant

Least squares estimate of
90% CI for the age of the universe:
# interval for age of universe in bn yr
km.mpc <- 3.09e19
yr.sec <- 1/(60*60*24*365)
confint(fit, level = 0.9)*km.mpc*yr.sec/1e9
5 % 95 %
velocity 10.98235 13.12108With 90% confidence, the universe is estimated to be between 10.98 and 13.12 billion years old.
STAT218
Inference in regression Confidence intervals and tests for coefficients in the SLR model