Nonparametric inference
Alternatives to t and F tests
Today’s agenda
- [lecture] nonparametric inference for medians/centers/locations
- [lab] nonparametric inference in R
Parametric inference
The inferences we’ve developed so far are based on simple statistical models:
- [one- and two-sample inference] tn−1 model
- [ANOVA] Fk−1,n−k model
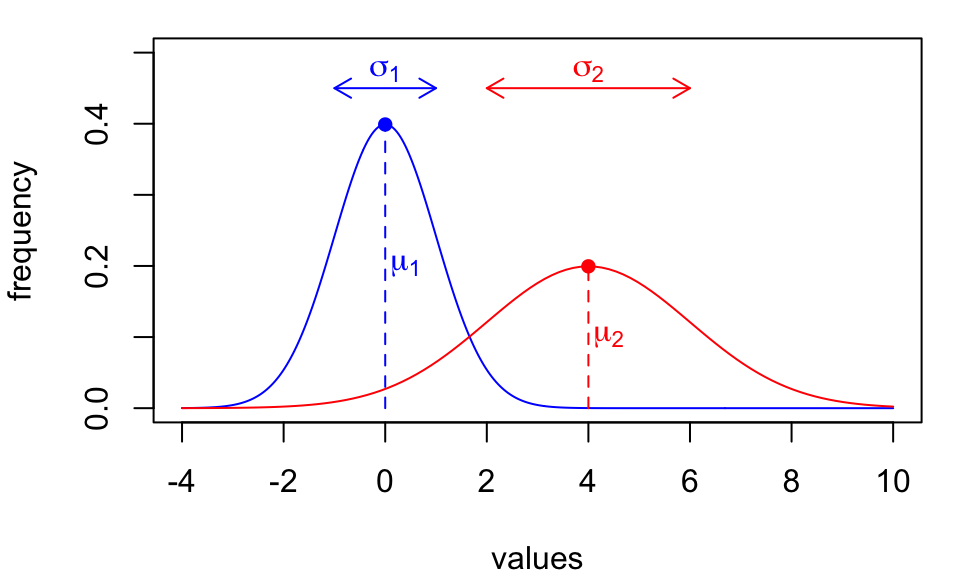
Both models assume underlying data distributions are described by…
- a specific bell-curved shape
- population parameters μ,σ
We call these called parametric methods.
Some failure modes
Parametric model assumptions don’t always hold.
Scenario 1: difficult to assess
DDT concentrations (ppm) in kale samples.

With only n=12 observations, it’s hard to assess the shape of the distribution.
Scenario 2: assumptions fail
Serum cholesterol (mg/L) on two diets.

The distribution for the oat bran group is right-skewed with an outlier to the left.
Inference for the median
| ddt | sign |
|---|---|
| 2.79 | - |
| 2.93 | - |
| 3.08 | + |
| 3.18 | + |
| 3.22 | + |
| 3.22 | + |
| 3.33 | + |
| 3.34 | + |
| 3.34 | + |
| 3.38 | + |
| 3.56 | + |
| 3.78 | + |
Consider the following hypothesis and alternative:
{H0:m=3(median is 3ppm)HA:m>3(median exceeds 3ppm)
If m=3 you’d expect 3ppm to evenly divide the data.
But actually 10 observations (83%) are larger and 2 observations (17%) are smaller; using combinatorics, this occurs by chance only 1.9% of the time.
The data provide evidence that median DDT in kale exceeds 3ppm (p = 0.019).
This is called a sign test, and it is nonparametric because it makes no assumptions about the underlying distribution.
Inference for the center
| ddt | di |
|---|---|
| 2.79 | -0.21 |
| 2.93 | -0.07 |
| 3.08 | 0.08 |
| 3.18 | 0.18 |
| 3.22 | 0.22 |
| 3.22 | 0.22 |
| 3.33 | 0.33 |
| 3.34 | 0.34 |
| 3.34 | 0.34 |
| 3.38 | 0.38 |
| 3.56 | 0.56 |
| 3.78 | 0.78 |
Now consider:
{H0:c=3(center is 3ppm)HA:c>3(center exceeds 3ppm) If the distribution is symmetric, deviations from center should be about the same in either direction.
The signed rank test leverages this expectation:
- [deviations] compute deviations di=xi−c0
- [signed ranks] compute vi=sign(di)×rank(di)
- [test statistic] add up positive signed ranks V=∑vi>0vi
If V is large, there is more spread to the right of c0, providing evidence favoring HA.
Inference for the center
| ddt | di | rank | sign | vi |
|---|---|---|---|---|
| 2.93 | -0.07 | 1 | -1 | -1 |
| 3.08 | 0.08 | 2 | 1 | 2 |
| 3.18 | 0.18 | 3 | 1 | 3 |
| 2.79 | -0.21 | 4 | -1 | -4 |
| 3.22 | 0.22 | 5.5 | 1 | 5.5 |
| 3.22 | 0.22 | 5.5 | 1 | 5.5 |
| 3.33 | 0.33 | 7 | 1 | 7 |
| 3.34 | 0.34 | 8.5 | 1 | 8.5 |
| 3.34 | 0.34 | 8.5 | 1 | 8.5 |
| 3.38 | 0.38 | 10 | 1 | 10 |
| 3.56 | 0.56 | 11 | 1 | 11 |
| 3.78 | 0.78 | 12 | 1 | 12 |
Signed rank statistic: V=2+3+5.5+5.5+7+8.5+8.5+10+11+12=73
There are 4096 possible sign combinations; of these, only about 0.43% give a larger value of V.
    Wilcoxon signed rank test with continuity correction

data:  ddt
V = 73, p-value = 0.004269
alternative hypothesis: true location is greater than 3
The data provide evidence that the center of the distribution of DDT in kale exceeds 3ppm (signed rank test, p = 0.00427).
Inference comparing centers
| bp | diet |
|---|---|
| 0 | FishOil |
| 12 | FishOil |
| 10 | FishOil |
| 2 | FishOil |
| 14 | FishOil |
| 8 | FishOil |
| -3 | RegularOil |
| -4 | RegularOil |
| -6 | RegularOil |
| 0 | RegularOil |
| 1 | RegularOil |
| 2 | RegularOil |
Consider using data on blood pressure percent reduction to test: {H0:cF=cR(no effect)HA:cF>cR(fish oil produces greater reduction)
If there is no effect of diet, ranks will be randomly distributed among groups. This idea leads to the rank sum test:
- [pool] Combine observations from both groups
- [rank] Sort and rank pooled observations
- [sum] Add up ranks in the first group
W=rank sum−n1(n1+1)2
When W is near 0 or n(n+1)2−n1(n1+1)2 there is more separation.
Inference comparing centers
| bp | diet | rank |
|---|---|---|
| -6 | RegularOil | 1 |
| -4 | RegularOil | 2 |
| -3 | RegularOil | 3 |
| 0 | FishOil | 4.5 |
| 0 | RegularOil | 4.5 |
| 1 | RegularOil | 6 |
| 2 | FishOil | 7.5 |
| 2 | RegularOil | 7.5 |
| 8 | FishOil | 9 |
| 10 | FishOil | 10 |
| 12 | FishOil | 11 |
| 14 | FishOil | 12 |
Rank sum statistic:
W=(4.5+7.5+9+10+11+12)⏟rank sum−6×72⏟adjustment=54−21=33 There are 924 ways to allocate ranks to groups; among these, larger values of W occur about 0.99% of the time.
    Wilcoxon rank sum test with continuity correction

data:  bp by diet
W = 33, p-value = 0.009903
alternative hypothesis: true location shift is greater than 0
The data provide evidence that fish oil reduces blood pressure by more than regular oil (rank sum test, p = 0.0099).
Kruskal-Wallis test

Here assumptions may not hold:
- sample sizes are small
- spread differs a bit
- outliers (tvarminne, petersburg)
- skewness (magadan, tillamook)
{H0:cM=cN=cTi=cTv=cPHA:ci≠cj for some i≠j An ANOVA-like test can be formulated using ranks of pooled observations: U=∑kj=1nj(ˉrj−ˉr)2∑ni=1(ri−ˉr)2(group variationtotal variation)
- ri: rank of the ith observation
- ˉrj: average rank within jth group
- ˉr: average rank
If there are location differences, U will be large.
Kruskal-Wallis test
Omnibus test for location differences:
    Kruskal-Wallis rank sum test

data:  aam.length by location
Kruskal-Wallis chi-squared = 16.405, df = 4, p-value = 0.002521
Post-hoc comparisions use pairwise rank sum tests:
    Pairwise comparisons using Wilcoxon rank sum exact test

data:  mussels$aam.length and mussels$location

           magadan newport tillamook tvarminne
newport    1.000   -       -         -
tillamook  1.000   1.000   -         -
tvarminne  0.293   0.127   0.312     -
petersburg 0.059   0.022   0.084     1.000

P value adjustment method: bonferroni
The data provide evidence that the distribution of AAM lengths differs by geographic location (Kruskal-Wallis test, p = 0.0025)
Pairwise comparisons indicate that distributions differ significantly between Petersburg and Newport populations (p = 0.022)
Comparison with ANOVA
The omnibus test in ANOVA gives a similar result:
            Df   Sum Sq   Mean Sq F value   Pr(>F)
location     4 0.004520 0.0011299   7.121 0.000281 ***
Residuals   34 0.005395 0.0001587
---
Signif. codes:  0 '***' 0.001 '**' 0.01 '*' 0.05 '.' 0.1 ' ' 1
But the pairwise comparisons differ:
# A tibble: 4 × 6
  contrast               estimate      SE    df t.ratio p.value
  <chr>                     <dbl>   <dbl> <dbl>   <dbl>   <dbl>
1 magadan - petersburg    -0.0254 0.00652    34   -3.90 0.00430
2 newport - tvarminne     -0.0209 0.00680    34   -3.07 0.0417
3 newport - petersburg    -0.0286 0.00652    34   -4.39 0.00103
4 tillamook - petersburg  -0.0232 0.00621    34   -3.74 0.00670
The parametric test is more sensitive to skewness and outliers!
Caveats
Two-sample and ANOVA-type rank-based inference procedures detect location shifts only.
While we write the hypotheses in terms of centers by convention, really we’re testing:
- H0: all observations come from one distribution
- HA: observations in at least one group tend to be larger/smaller than the other(s)
These tests are not sensitive to alternatives in which centers differ due to shape.

Summary
Nonparametric methods provide attractive alternatives to t and F tests when assumptions don’t hold or aren’t easily checked.
helpful for small sample sizes or odd data distributions
more robust to outliers
fewer assumptions
| Method | Test of… | Assumptions | |
|---|---|---|---|
| One-sample inference | Sign test | median | none |
| Signed rank test | center/location | symmetric data distribution | |
| Two-sample inference | Rank sum test | center/location | location shifts only |
| ANOVA-type inference | Kruskal-Wallis test | center/location | location shifts only |
STAT218
Nonparametric inference Alternatives to t and F tests