# import data
load('data/lizards.RData')

# side-by-side boxplots

# test for a difference in mean top speed

# point estimate and standard error

# confidence intervalHomework 5
The table and figures below show summary statistics and distributions of clutch sizes for two of the sites in the
frogdata from Test 1.- Compute a point estimate and standard error for the difference in mean clutch sizes between the two sites.
- Compute the test statistic you would use to test whether mean clutch size differs by site.
- Construct an approximate 99% confidence interval for the difference in mean clutch sizes.
- What would the conclusion of the test be at the 1% level?
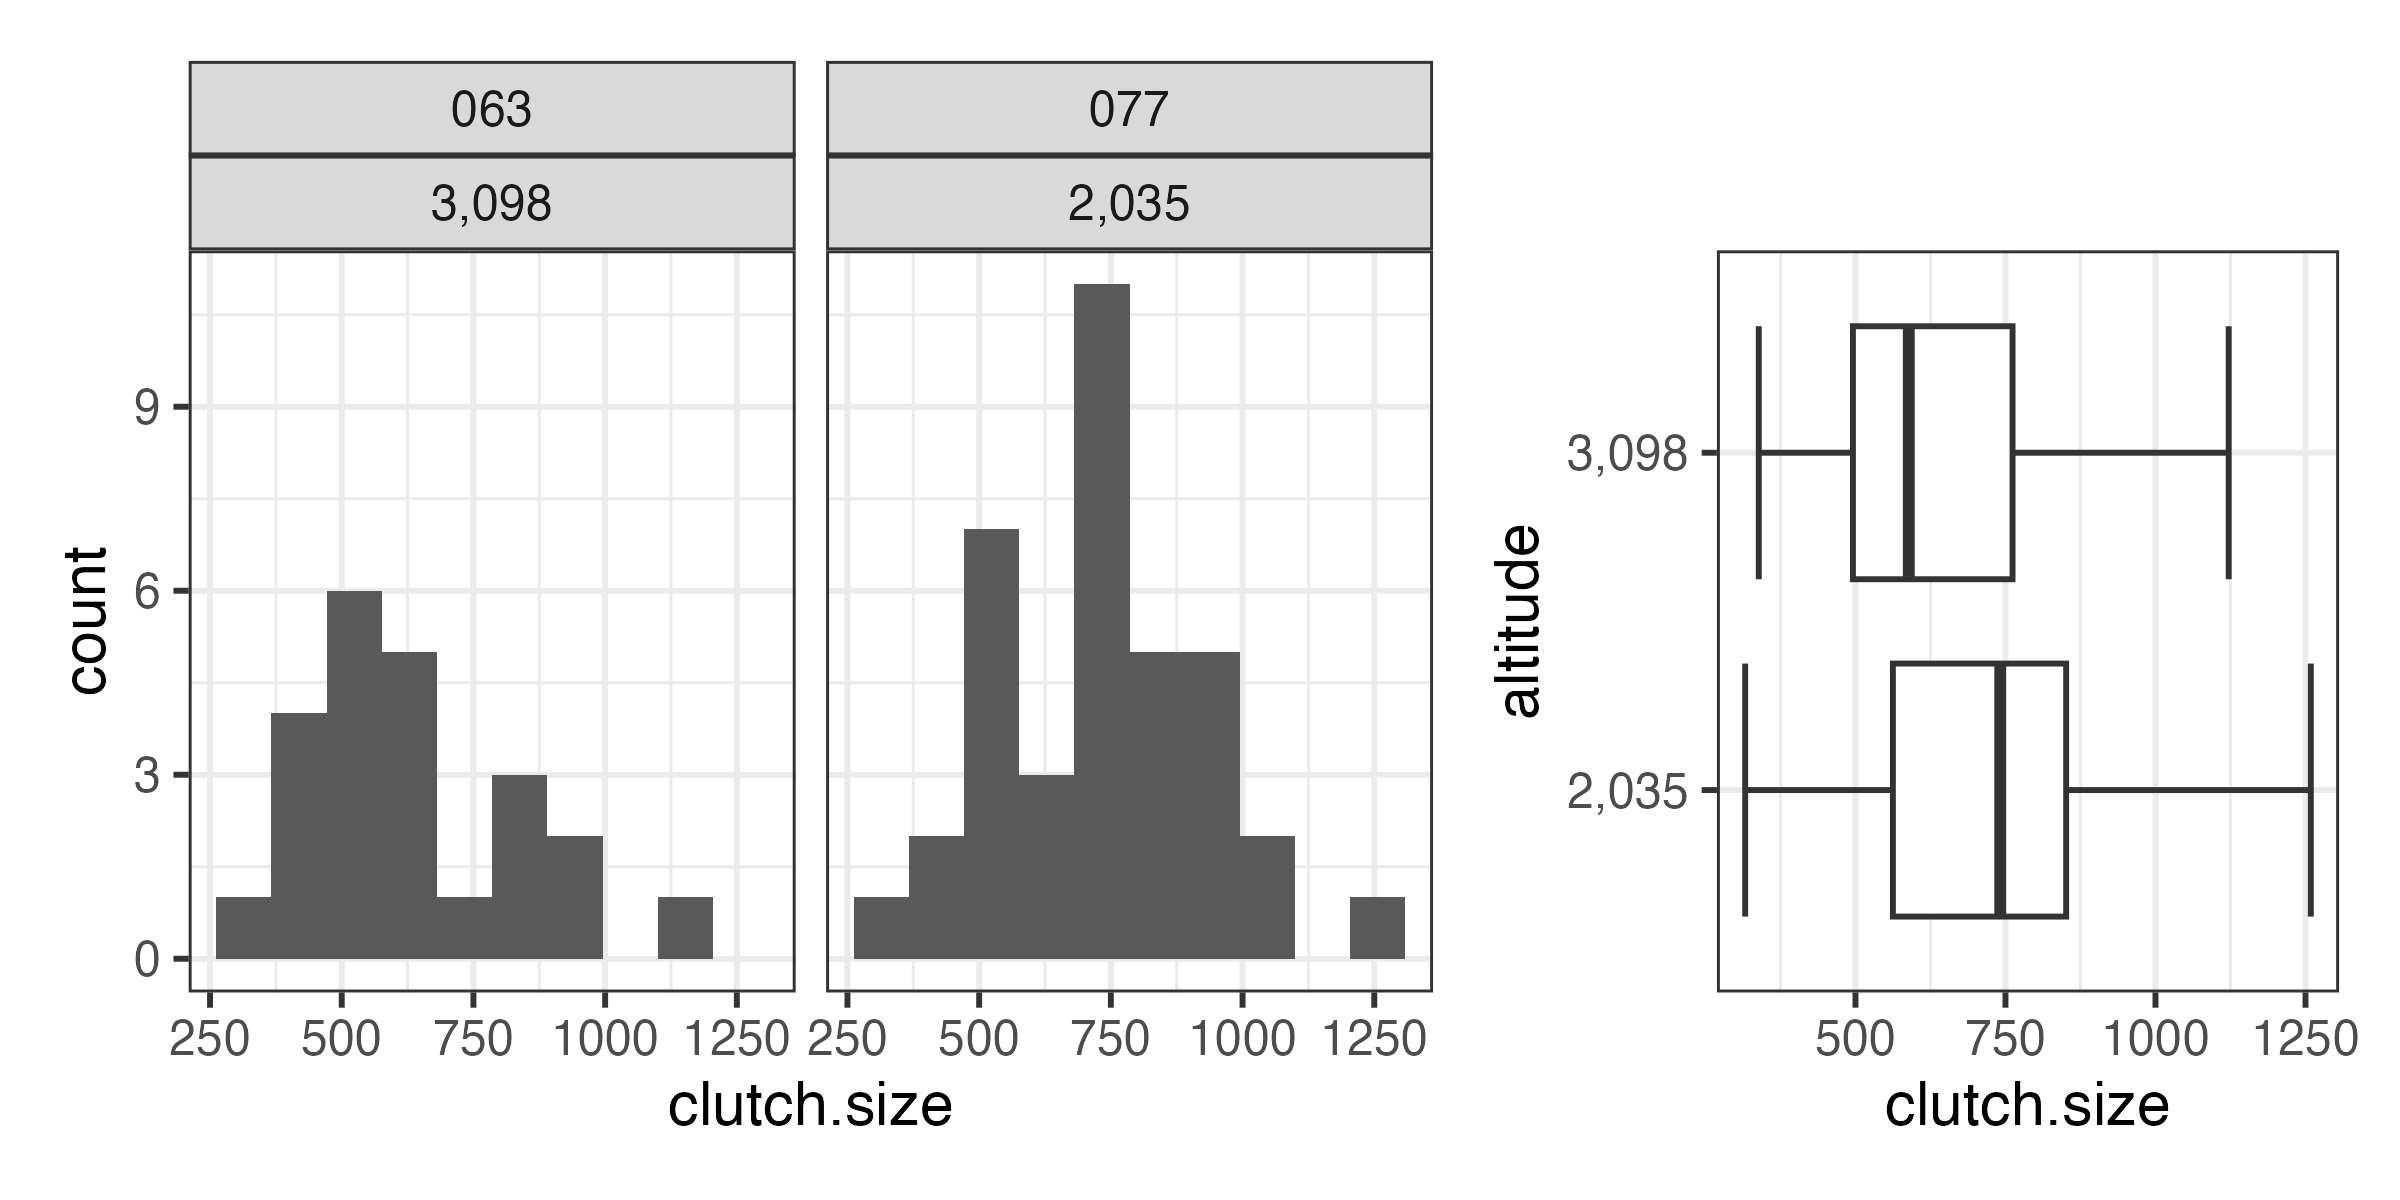
| site | altitude | csize.mean | csize.sd | n |
|---|---|---|---|---|
| 063 | 3,098 | 625.67 | 197.01 | 23 |
| 077 | 2,035 | 733.44 | 202.72 | 37 |
Solution
Do this one by hand based on the output above. You can, if you wish, perform calculations in R in the cell below.
- [your answer here]
- [your answer here]
- [your answer here]
- [your answer here]
The
lizardsdata contains top running speeds in meters per second (m/s) from two species of lizard: western fence and sagebrush.- Construct side-by-side boxplots and comment on whether there appears to be a difference in mean top running speed between species. If so, which species appears to run faster?
- Test for a difference in mean top running speed between species at the 5% level. Report the test result following conventional style.
- Compute a point estimate for the difference in means and a standard error. Report the estimate following conventional style.
- Construct and interpret an interval estimate consistent with your test.
Solution
- [your answer here]
- [your answer here]
- [your answer here]
- [your answer here]